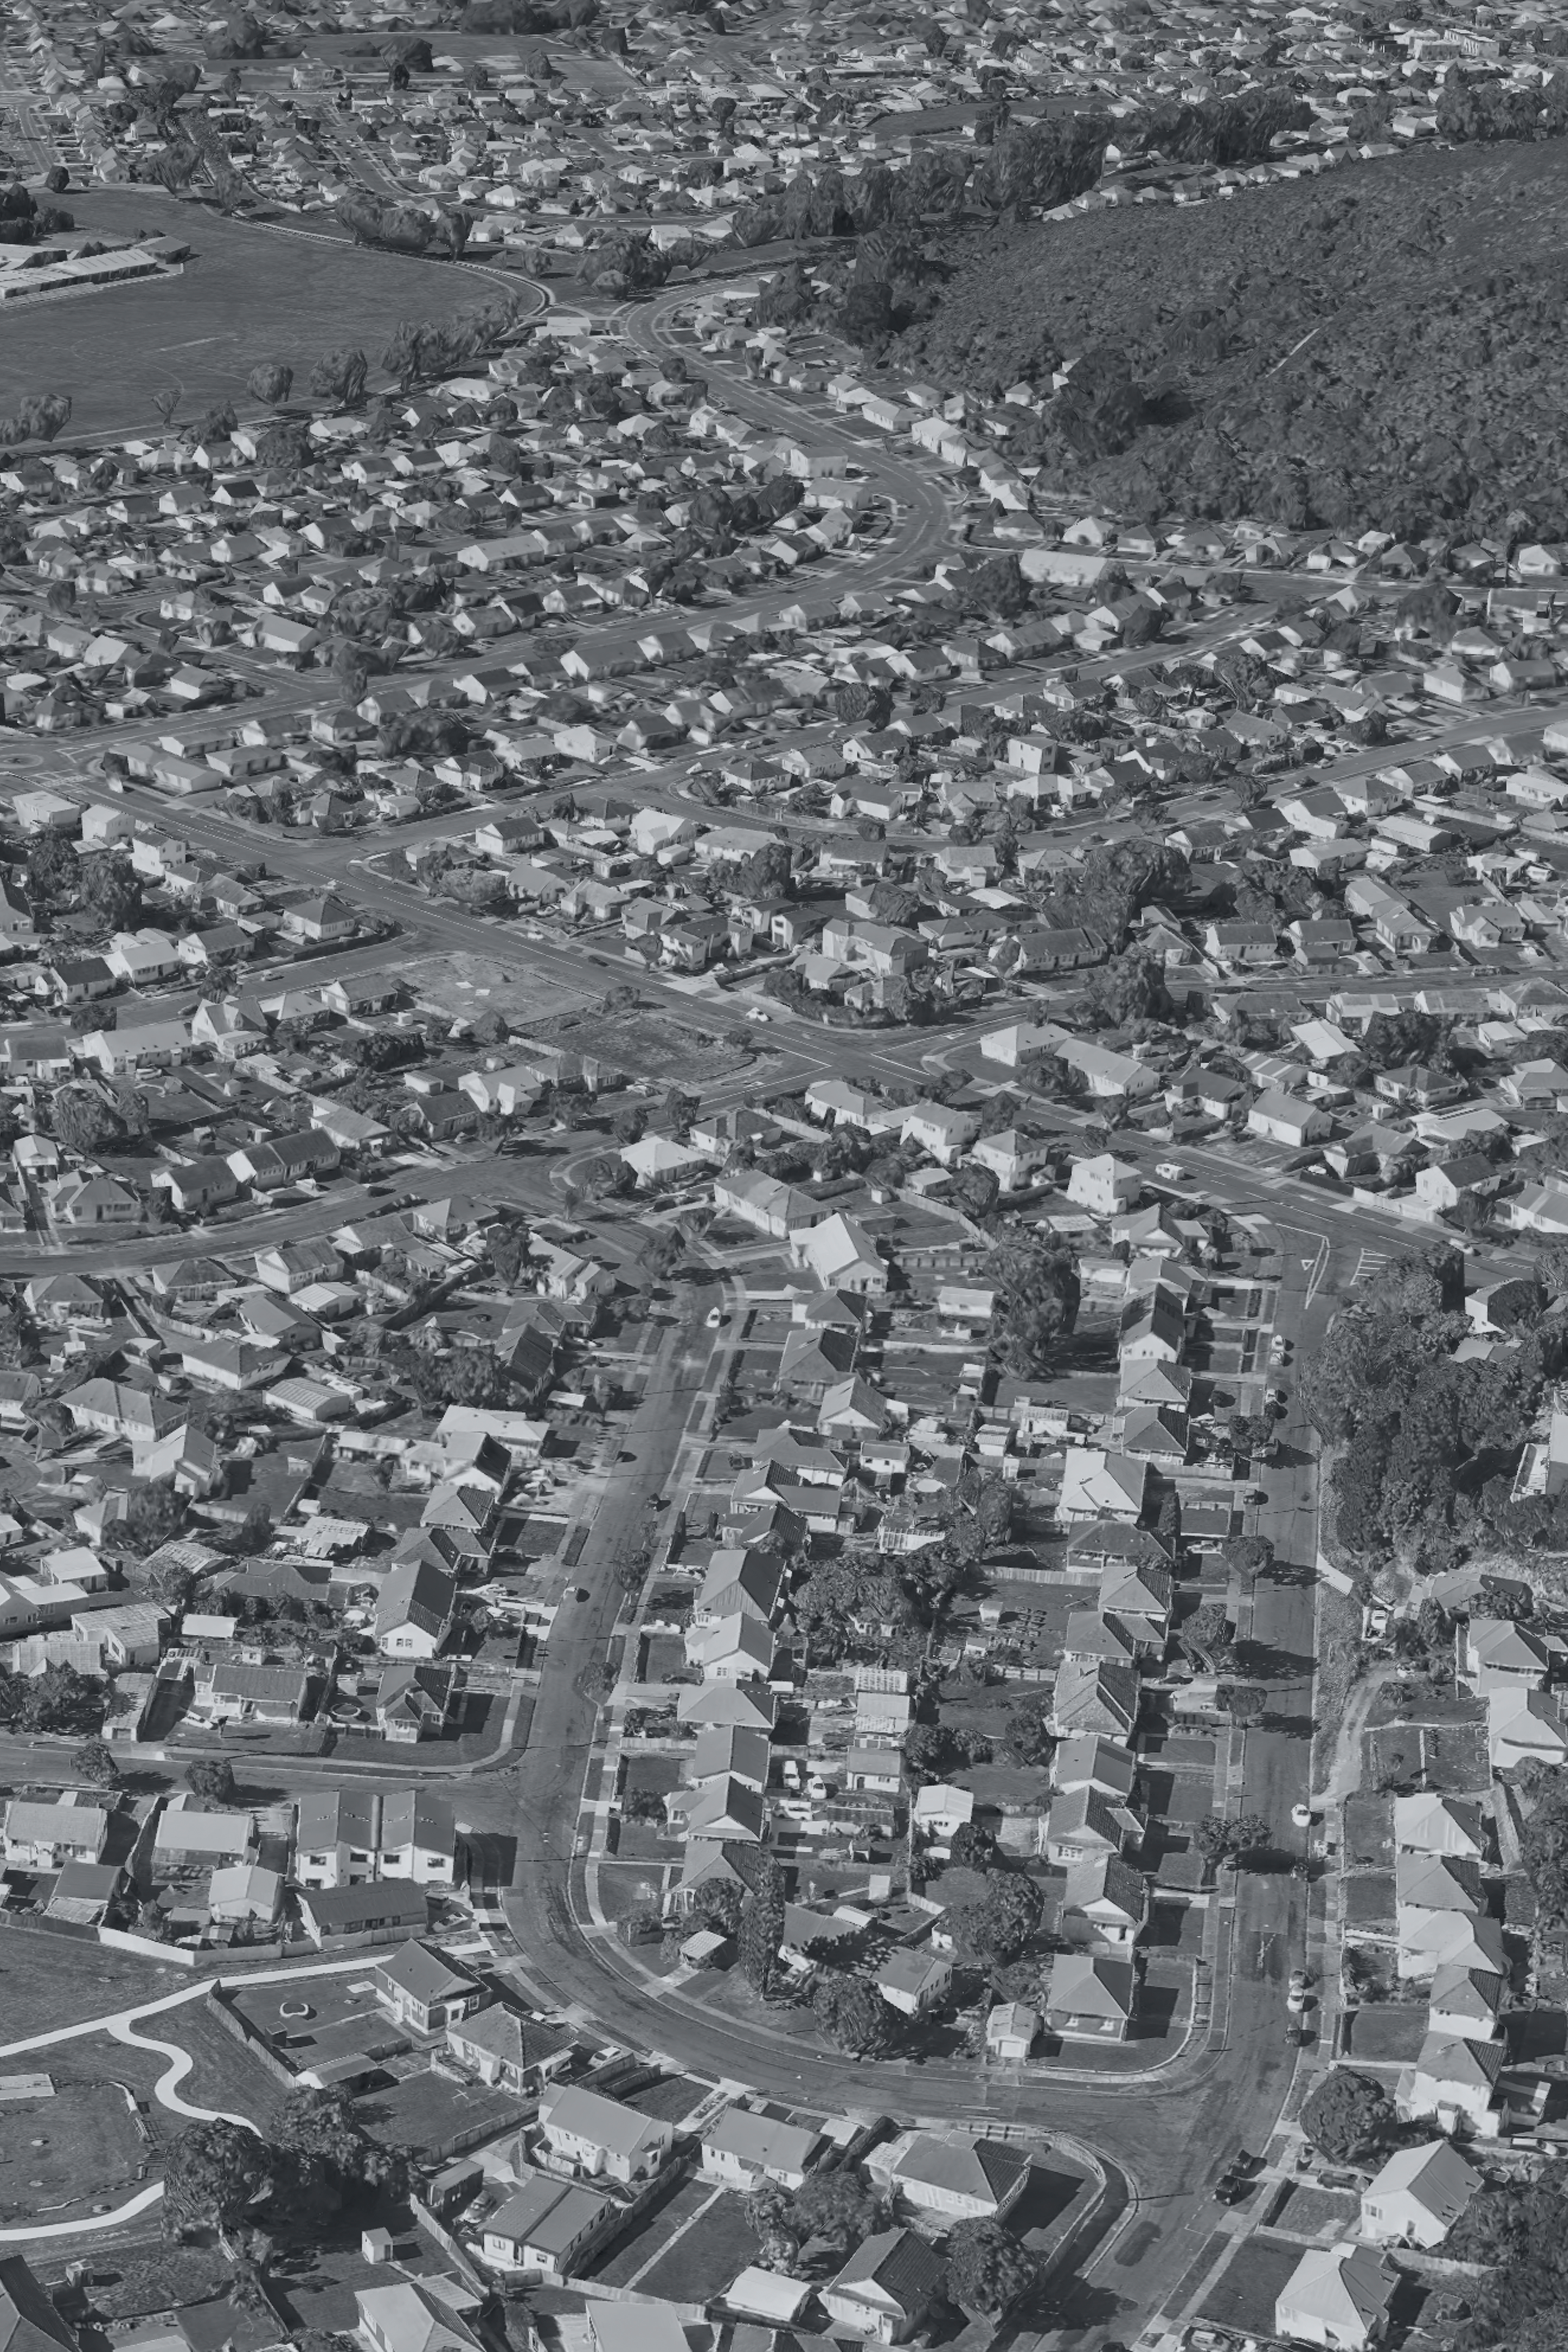

Goldilocks Sites are about finding sites with the right balance — not too small, not too large, but “just right” for infill housing. This page outlines the research undertaken to identify Goldilocks Sites. It looks across Aotearoa New Zealand to identify public housing parcels that fit this middle ground: big enough to add new homes, yet modest enough to blend into existing neighbourhoods. By testing each site against planning rules, physical form, and access to local services, the study shows how everyday housing land can quietly grow into stronger, more sustainable communities.
At a glance
Across Aotearoa New Zealand there are 42,802 public housing sites. They come in many shapes and sizes: some hold apartment blocks, some are car parks or vacant lots, and many contain a single standalone home. Closer analysis shows that about one third — just over 14,500 properties — could support some kind of infill housing without demolishing the existing house, and likely without needing a resource consent. Around 4,500 further sites are also large and flat enough for infill development, but because of the number of homes already on them, new building would require resource consent.
Last standing site
To reach the above conclusions, public housing sites were tested against planning rules, physical limitations, and social context. This helped identify the sites most suited to Bluefield development.
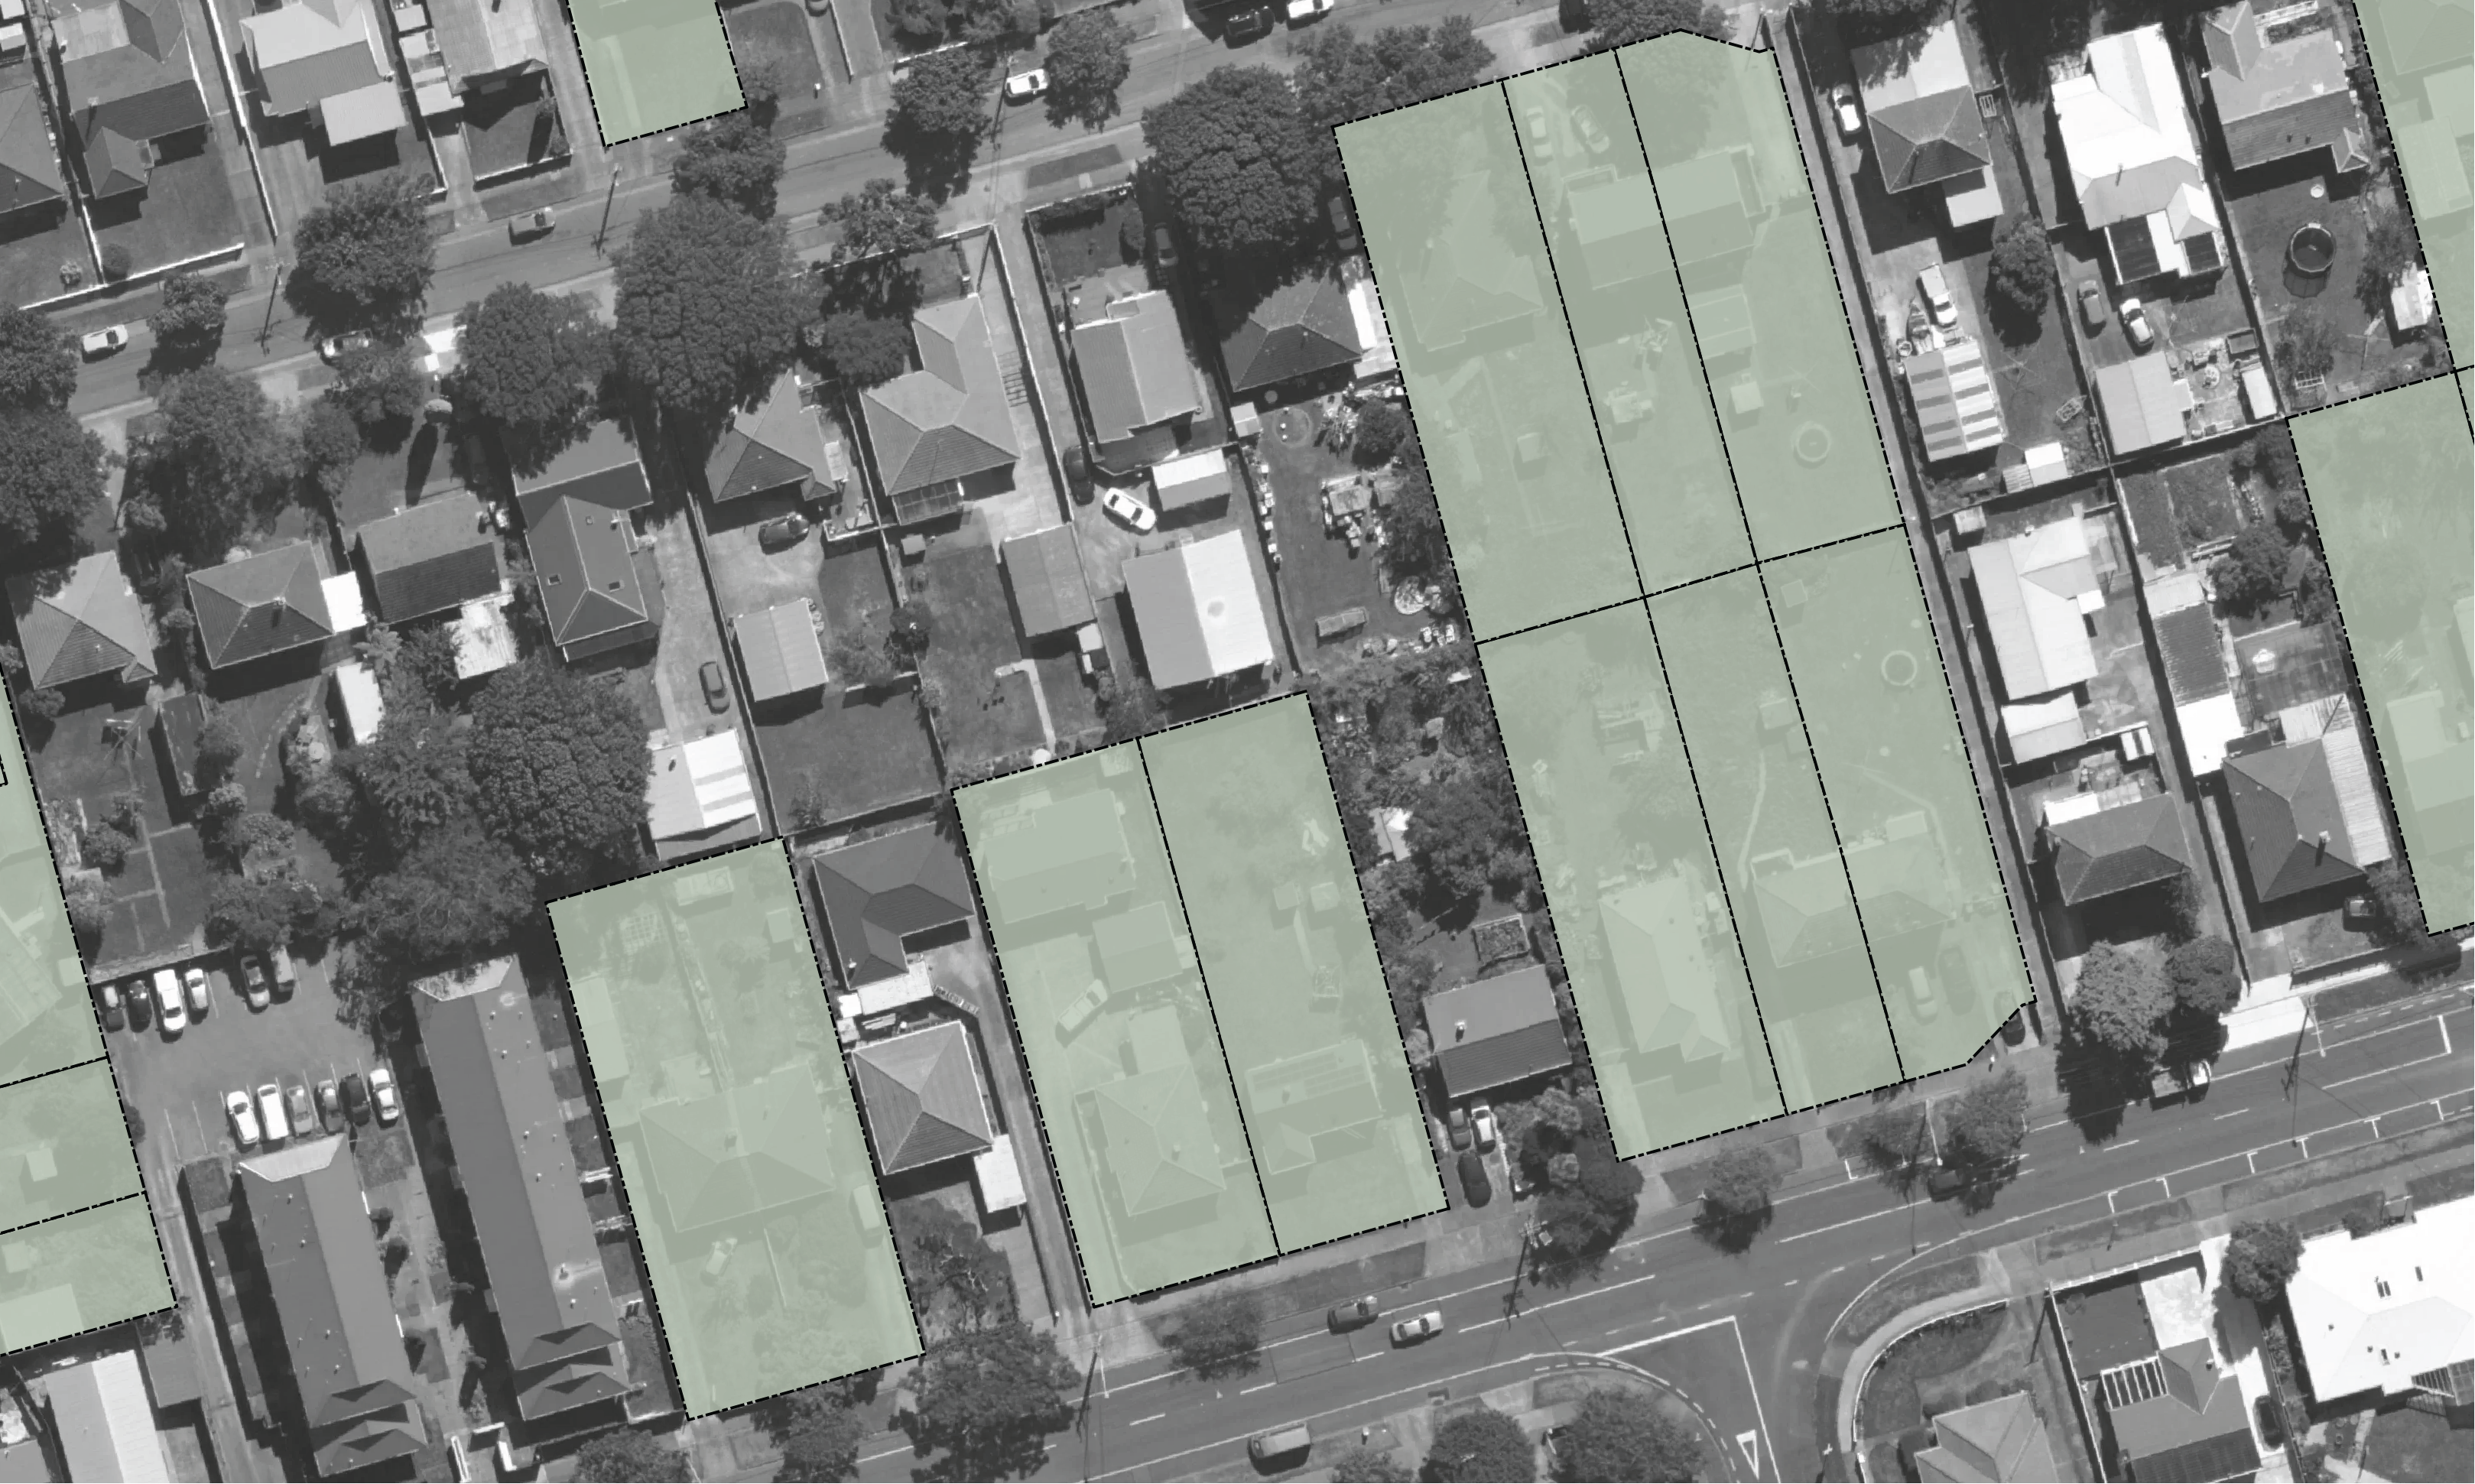
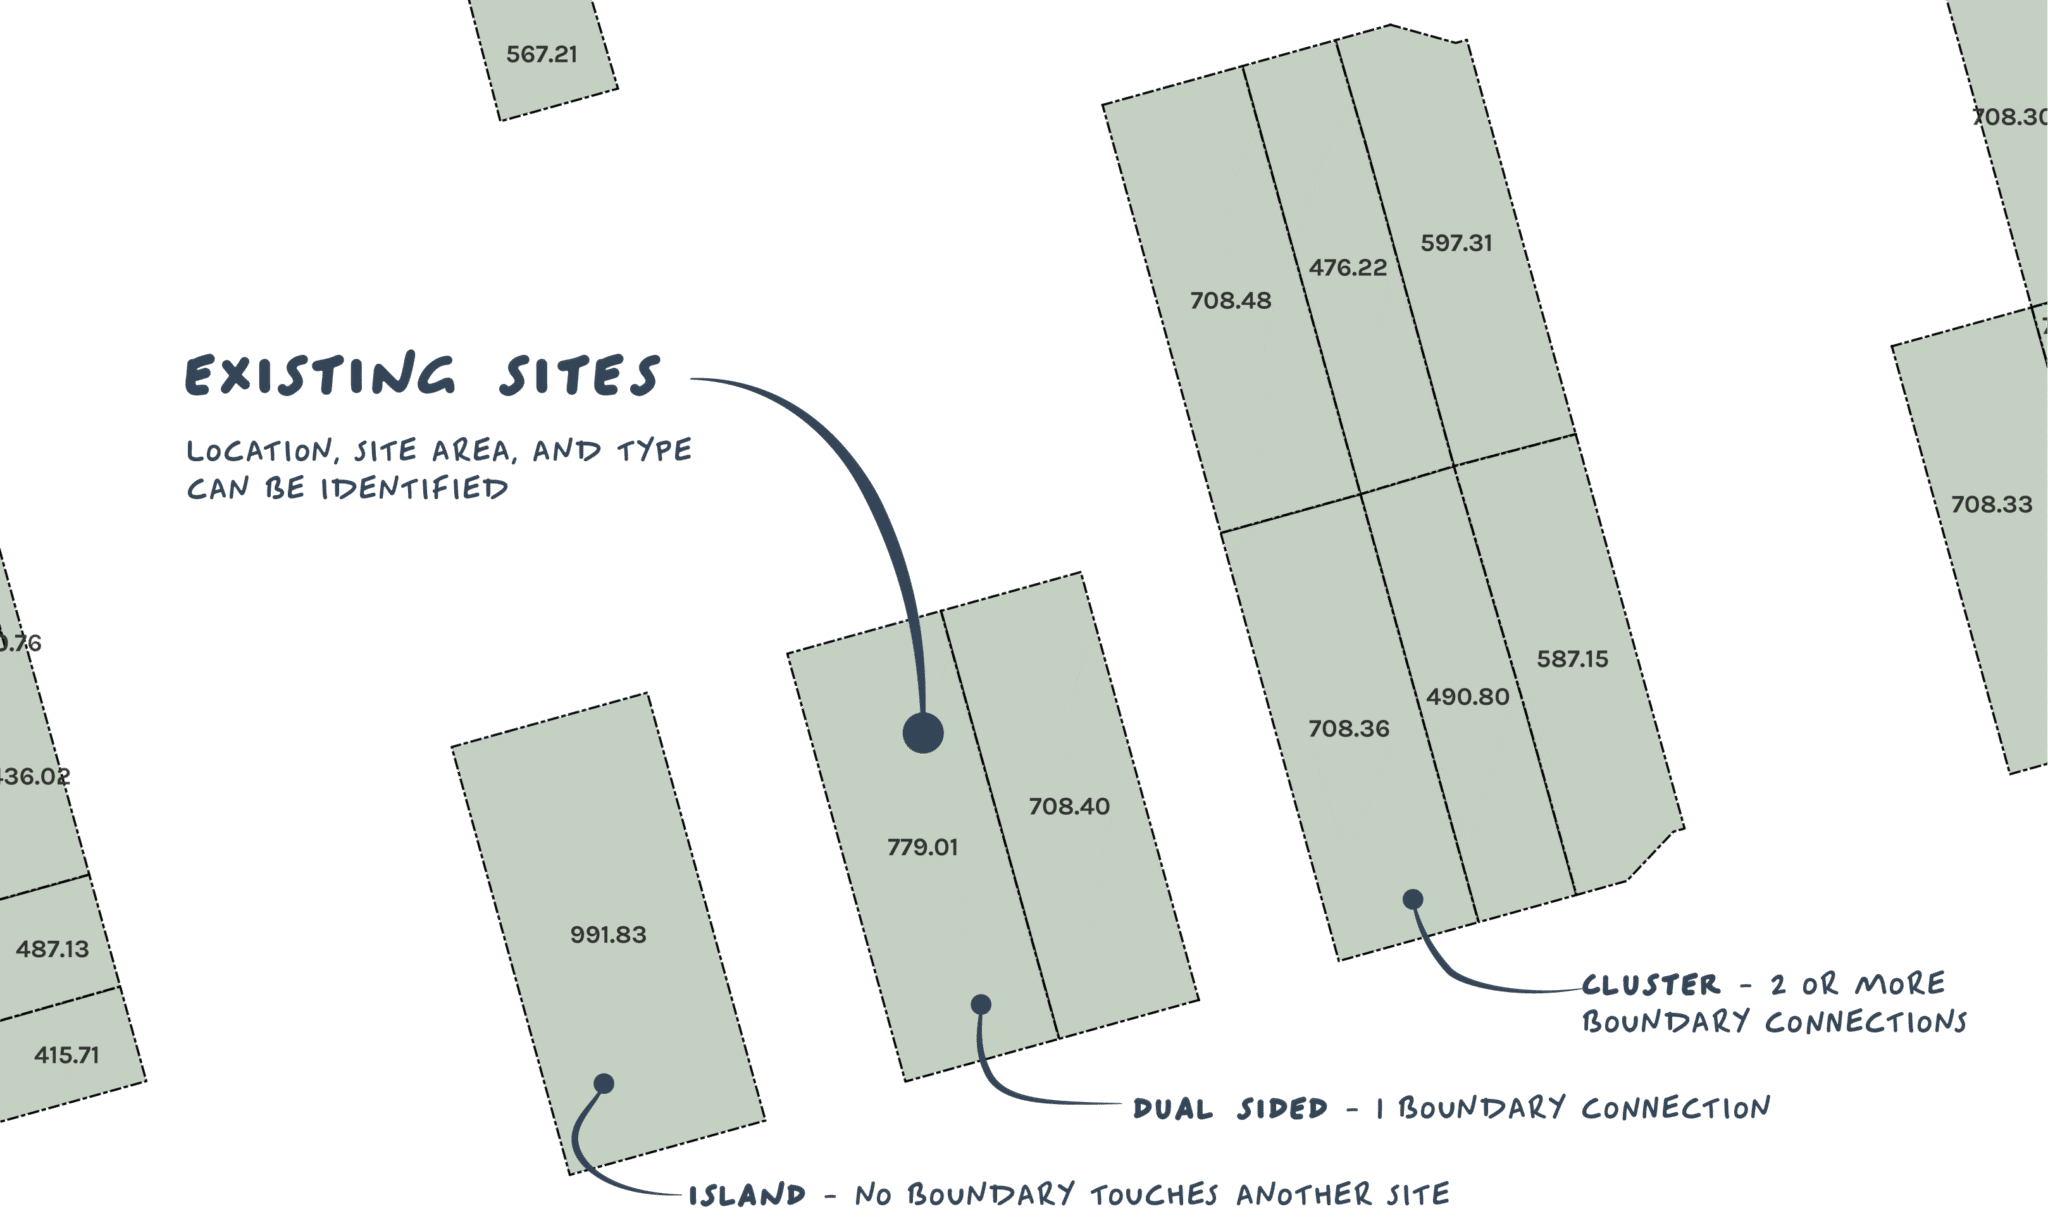
First, a dataset of all public housing sites was necessary. A dataset was built from the LINZ Central Record of State Land, narrowed to sites managed by public housing providers, and projected in GIS software. The LINZ data shows where sites are. GIS software was used to determine how large sites are and how they connect. Some are “islands,” surrounded by private dwellings, while others form clusters of adjoining parcels. Clusters are more efficient to redevelop, as larger sites can be combined and rebuilt, while island sites are often better suited to smaller-scale infill that adds homes alongside existing dwellings.
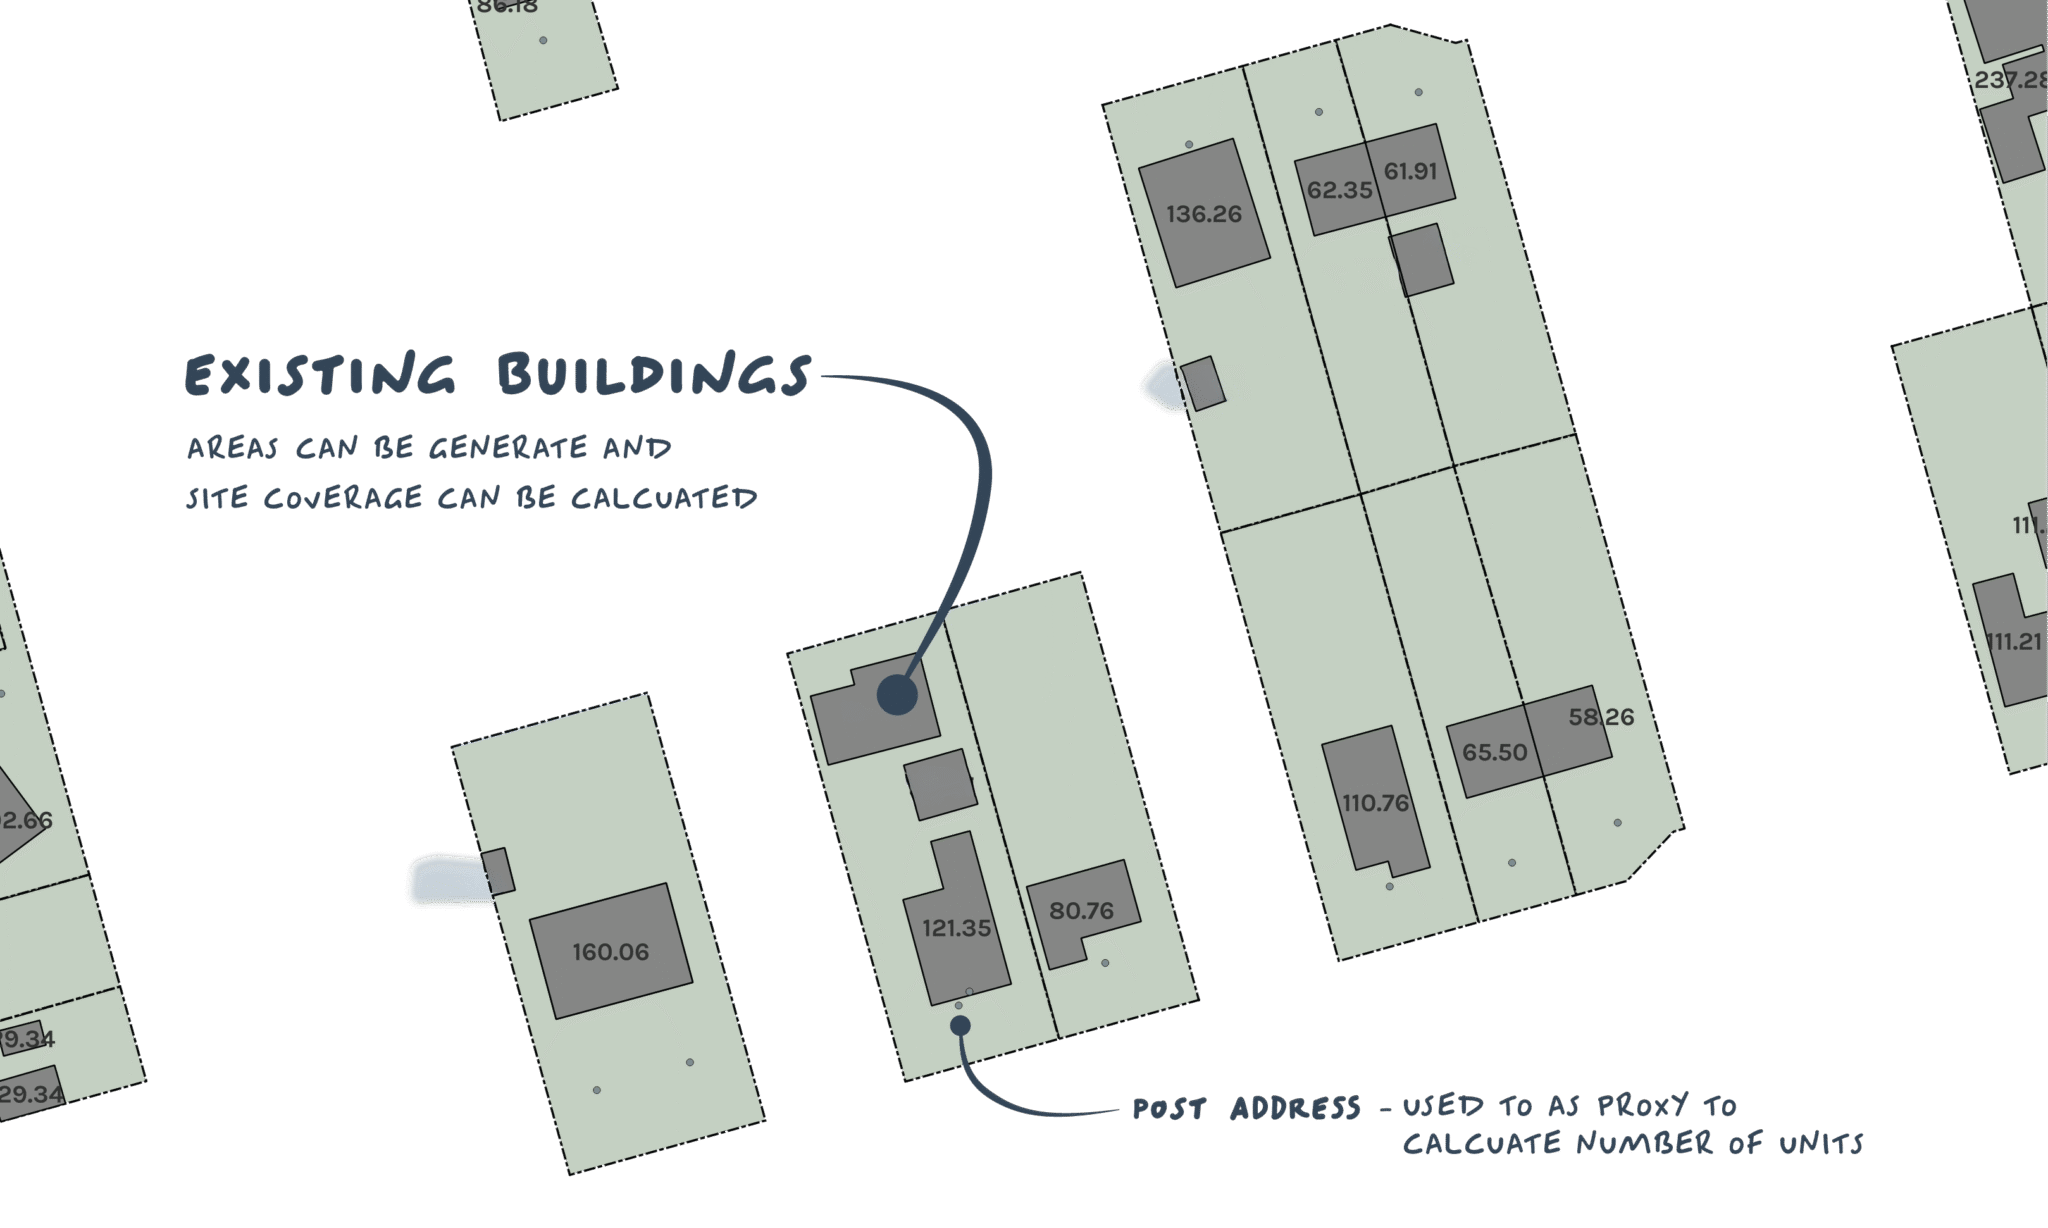
First, the sites were tested against planning rules. Building outlines from aerial imagery were compared with address data to estimate both how much of each parcel was already covered by buildings and how many households existed on it. These numbers were then set against local council rules on site coverage and unit numbers, giving a picture of how many additional homes could theoretically be built without breaching planning limits.
Second, the physical feasibility of sites were considered. Boundaries and setbacks from existing homes were trimmed back to define a realistic buildable area. Within that space, the largest possible rectangle was fitted, creating a simple but consistent way to measure development potential. The dimensions of each rectangle — length, width, and orientation — provide a clear picture of what could physically fit, while slope data from the New Zealand Digital Elevation Model was used to screen out land that was too steep for practical construction.
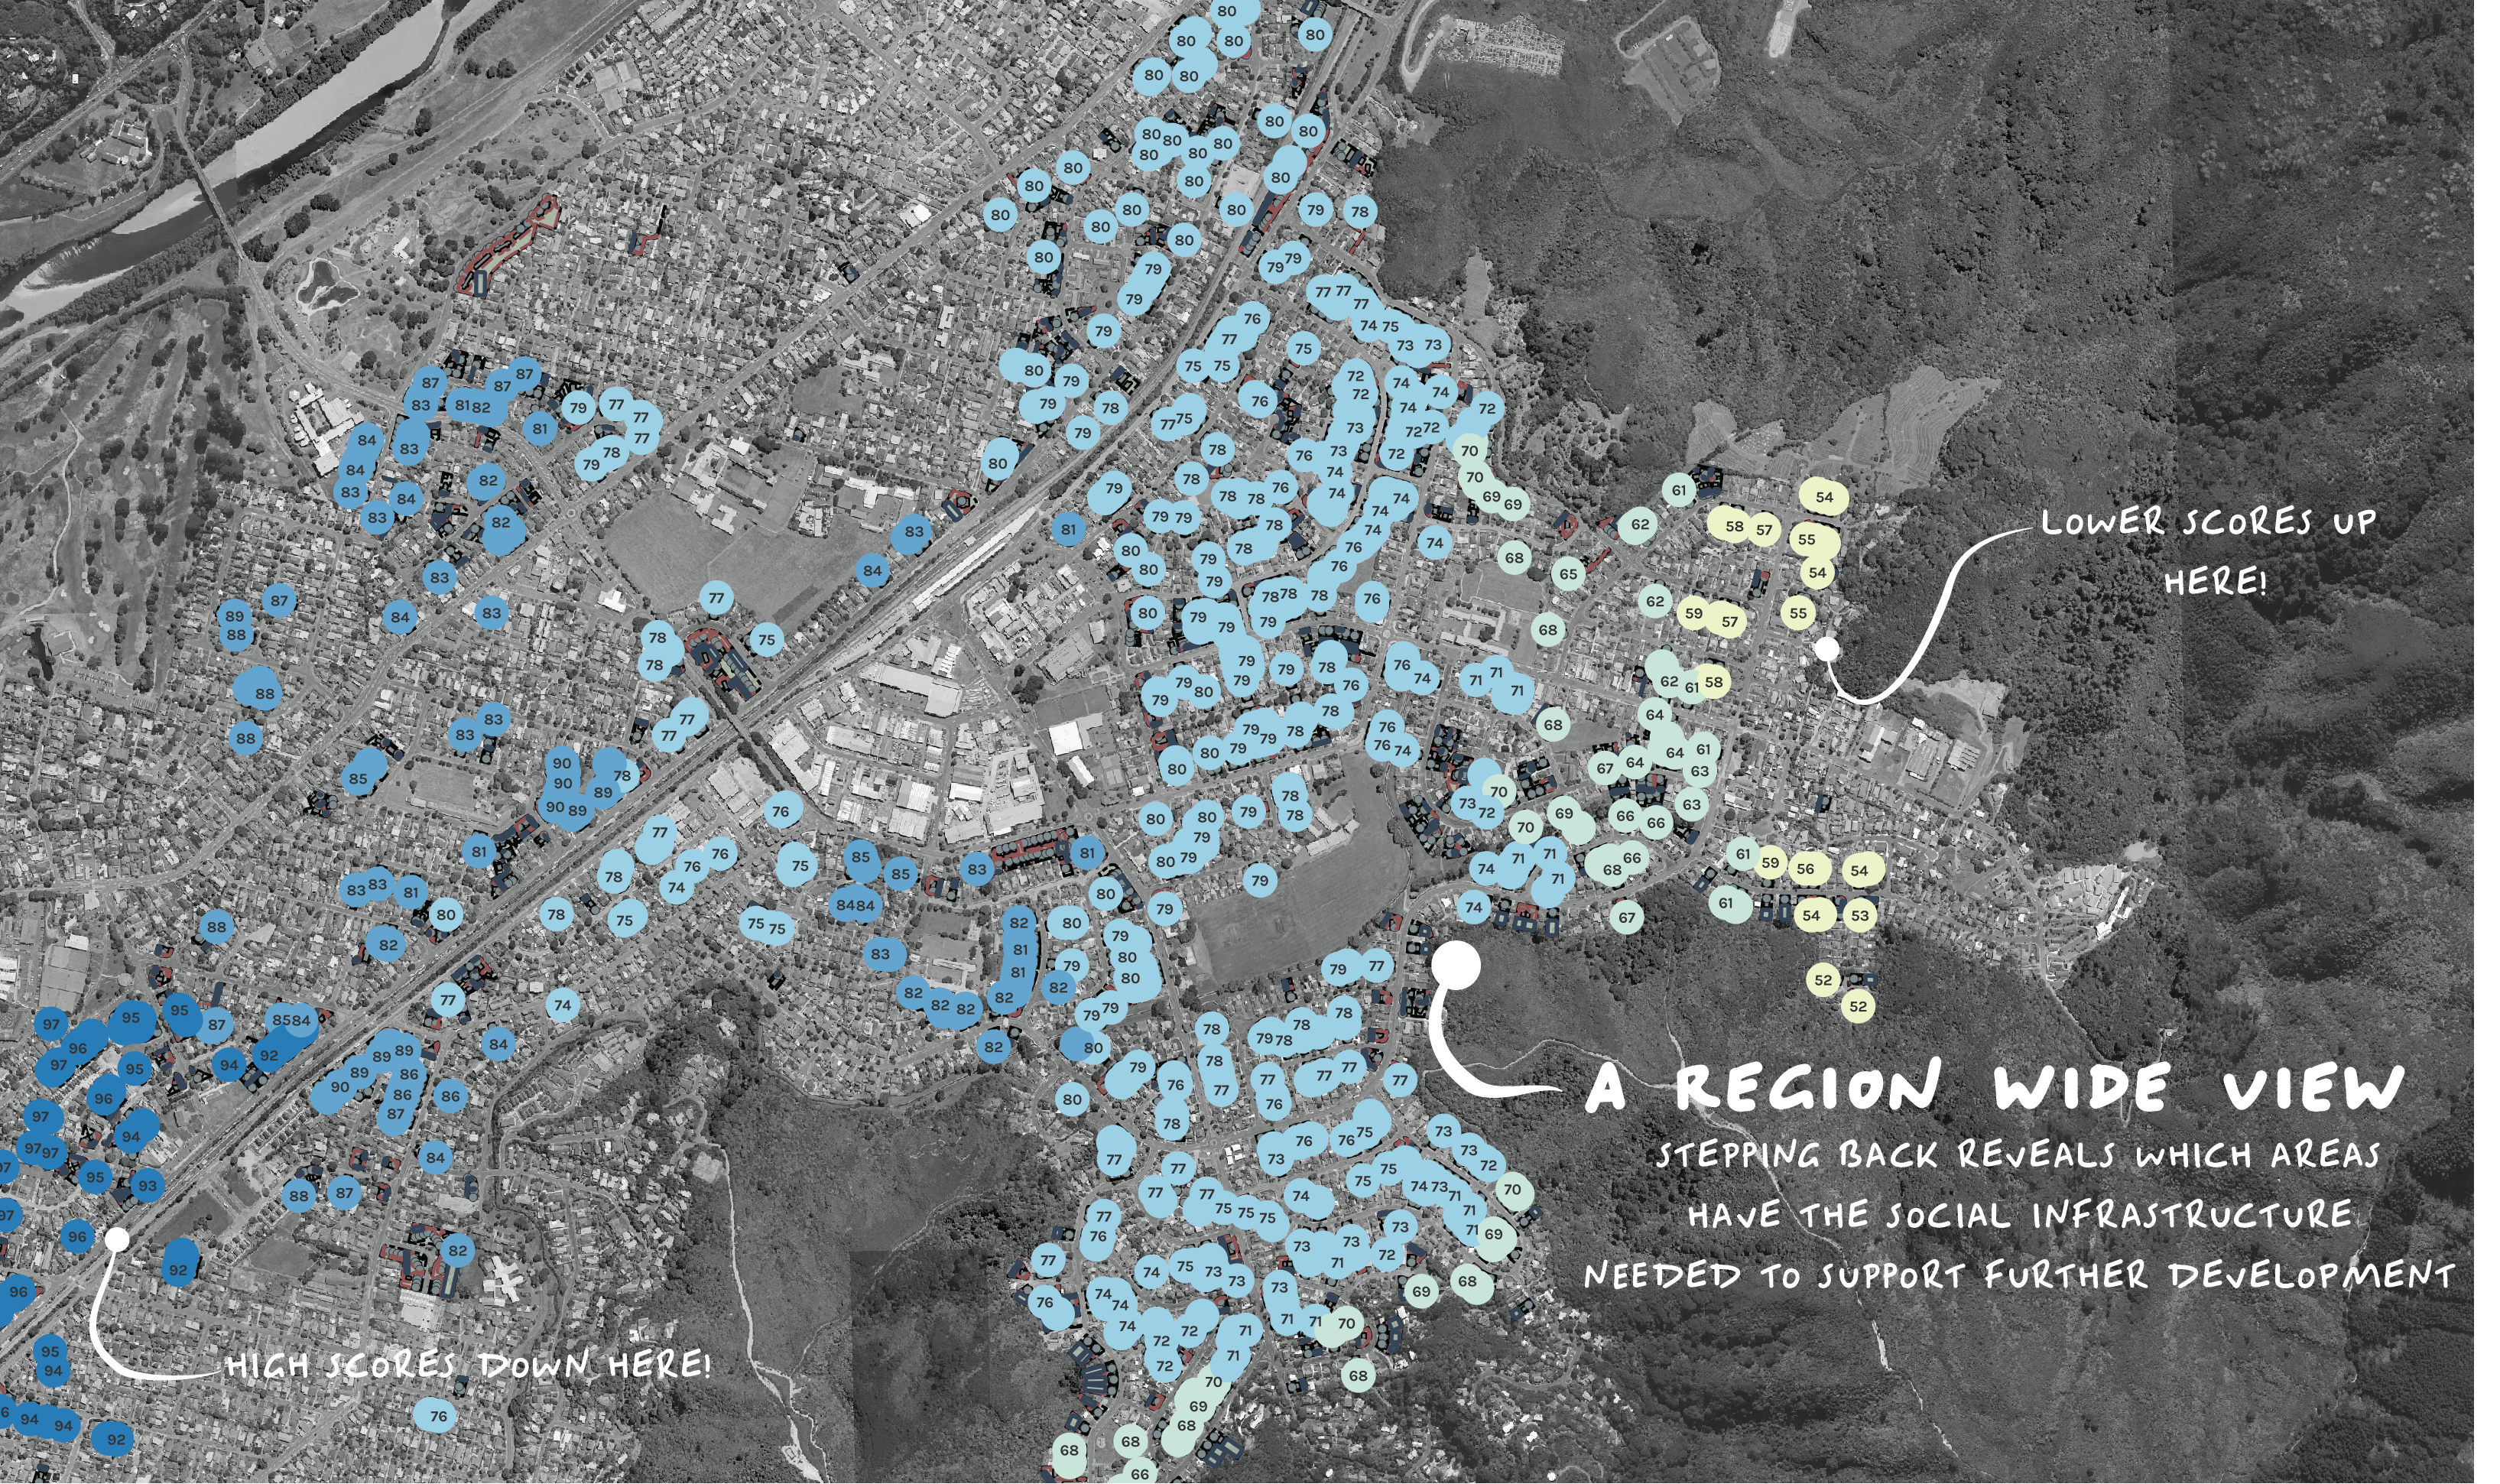
Finally, the social context of each site was considered. Each parcel was given a social infrastructure score, rating its proximity to essential services such as shops, schools, transport, parks, and healthcare. Sites close to many services scored higher, while those more isolated scored lower. No sites were excluded at this stage, but the scores provide a useful comparison of where Bluefield development would most benefit tenants and communities.
Together, these steps highlight which sites are “just right” for Bluefield housing: technically possible, legally viable, and well located to support stronger communities.
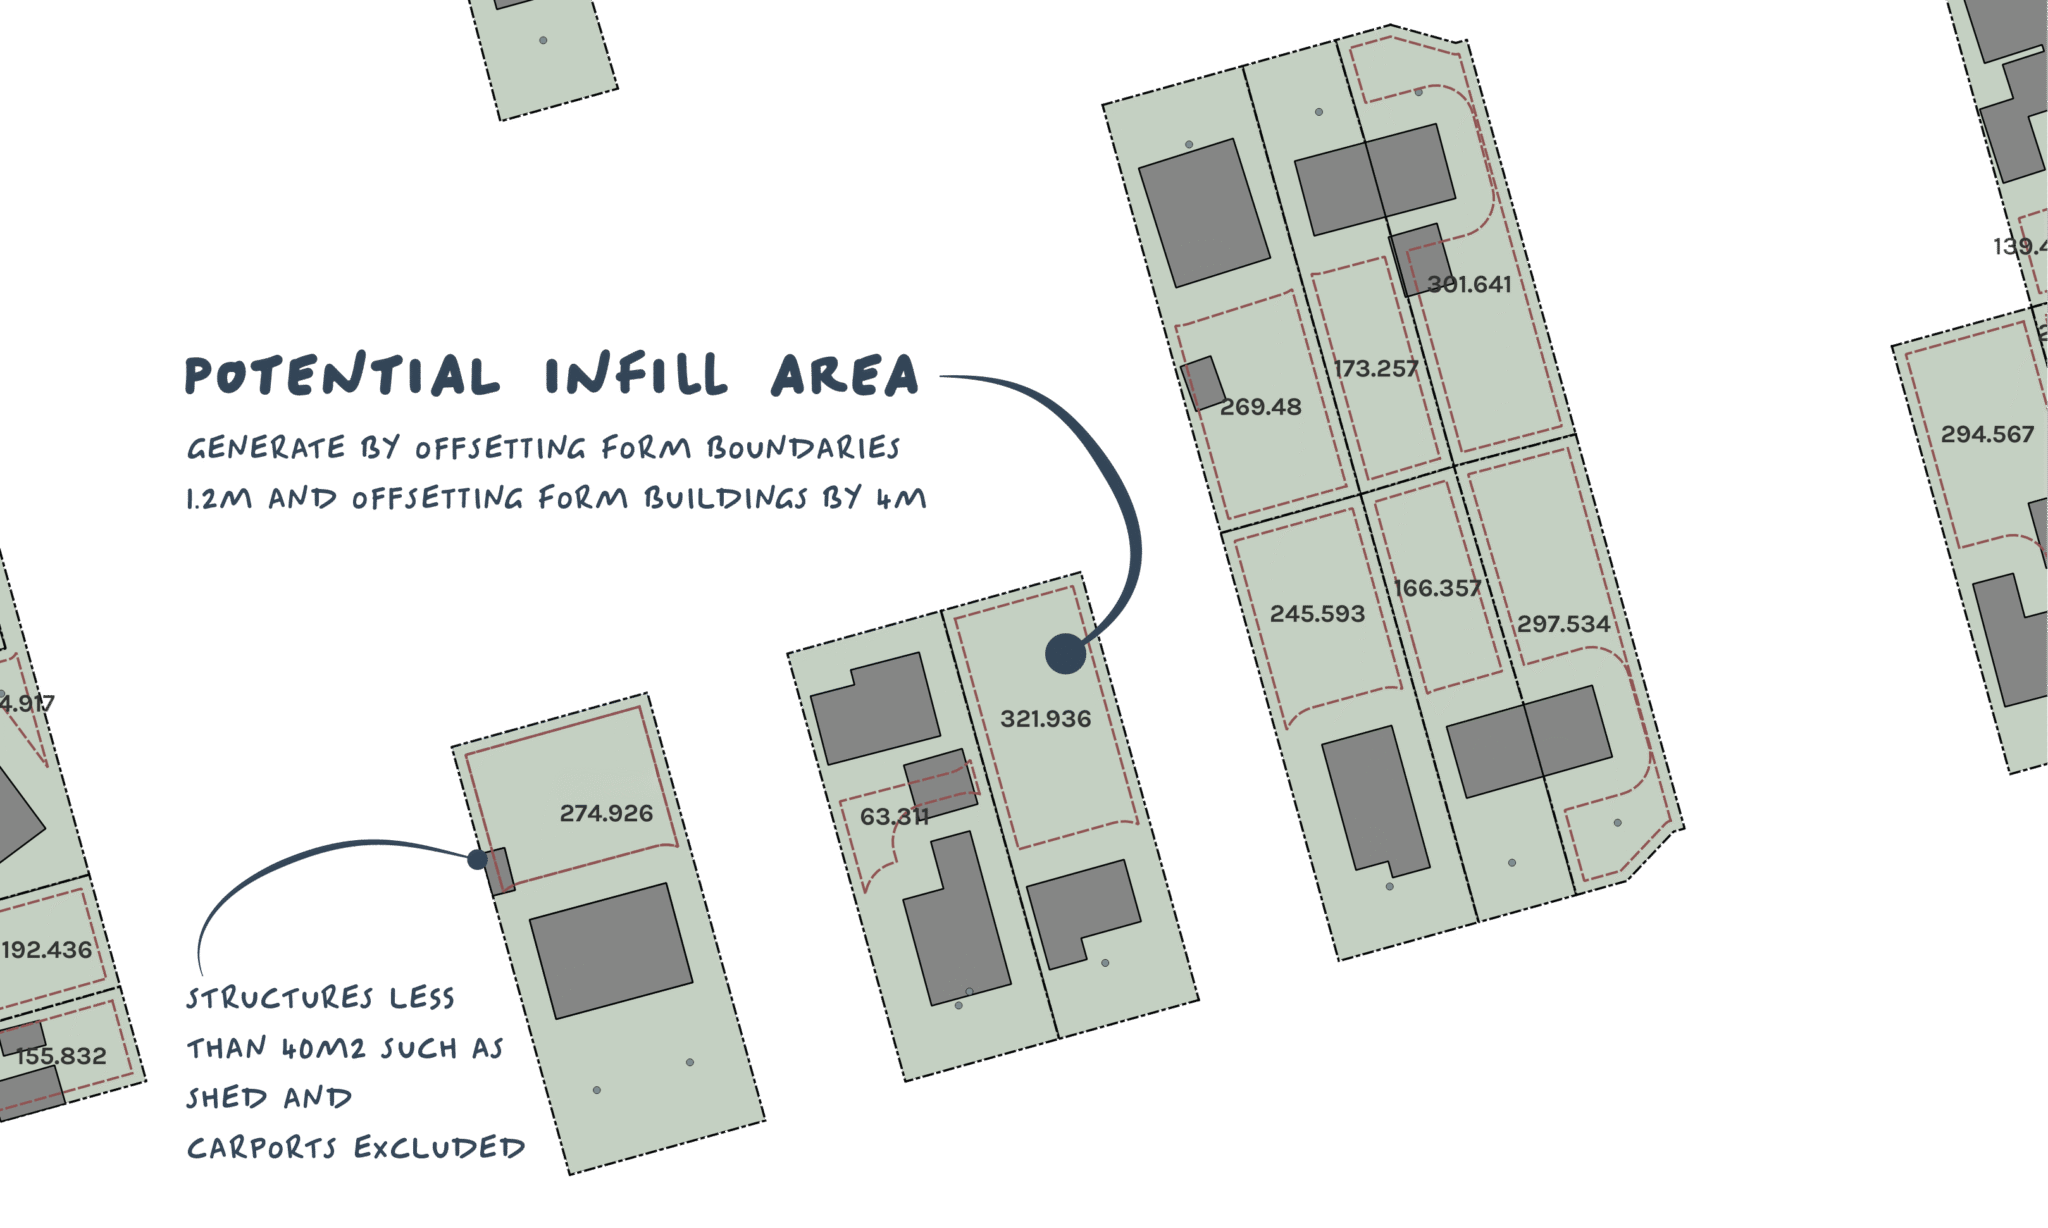
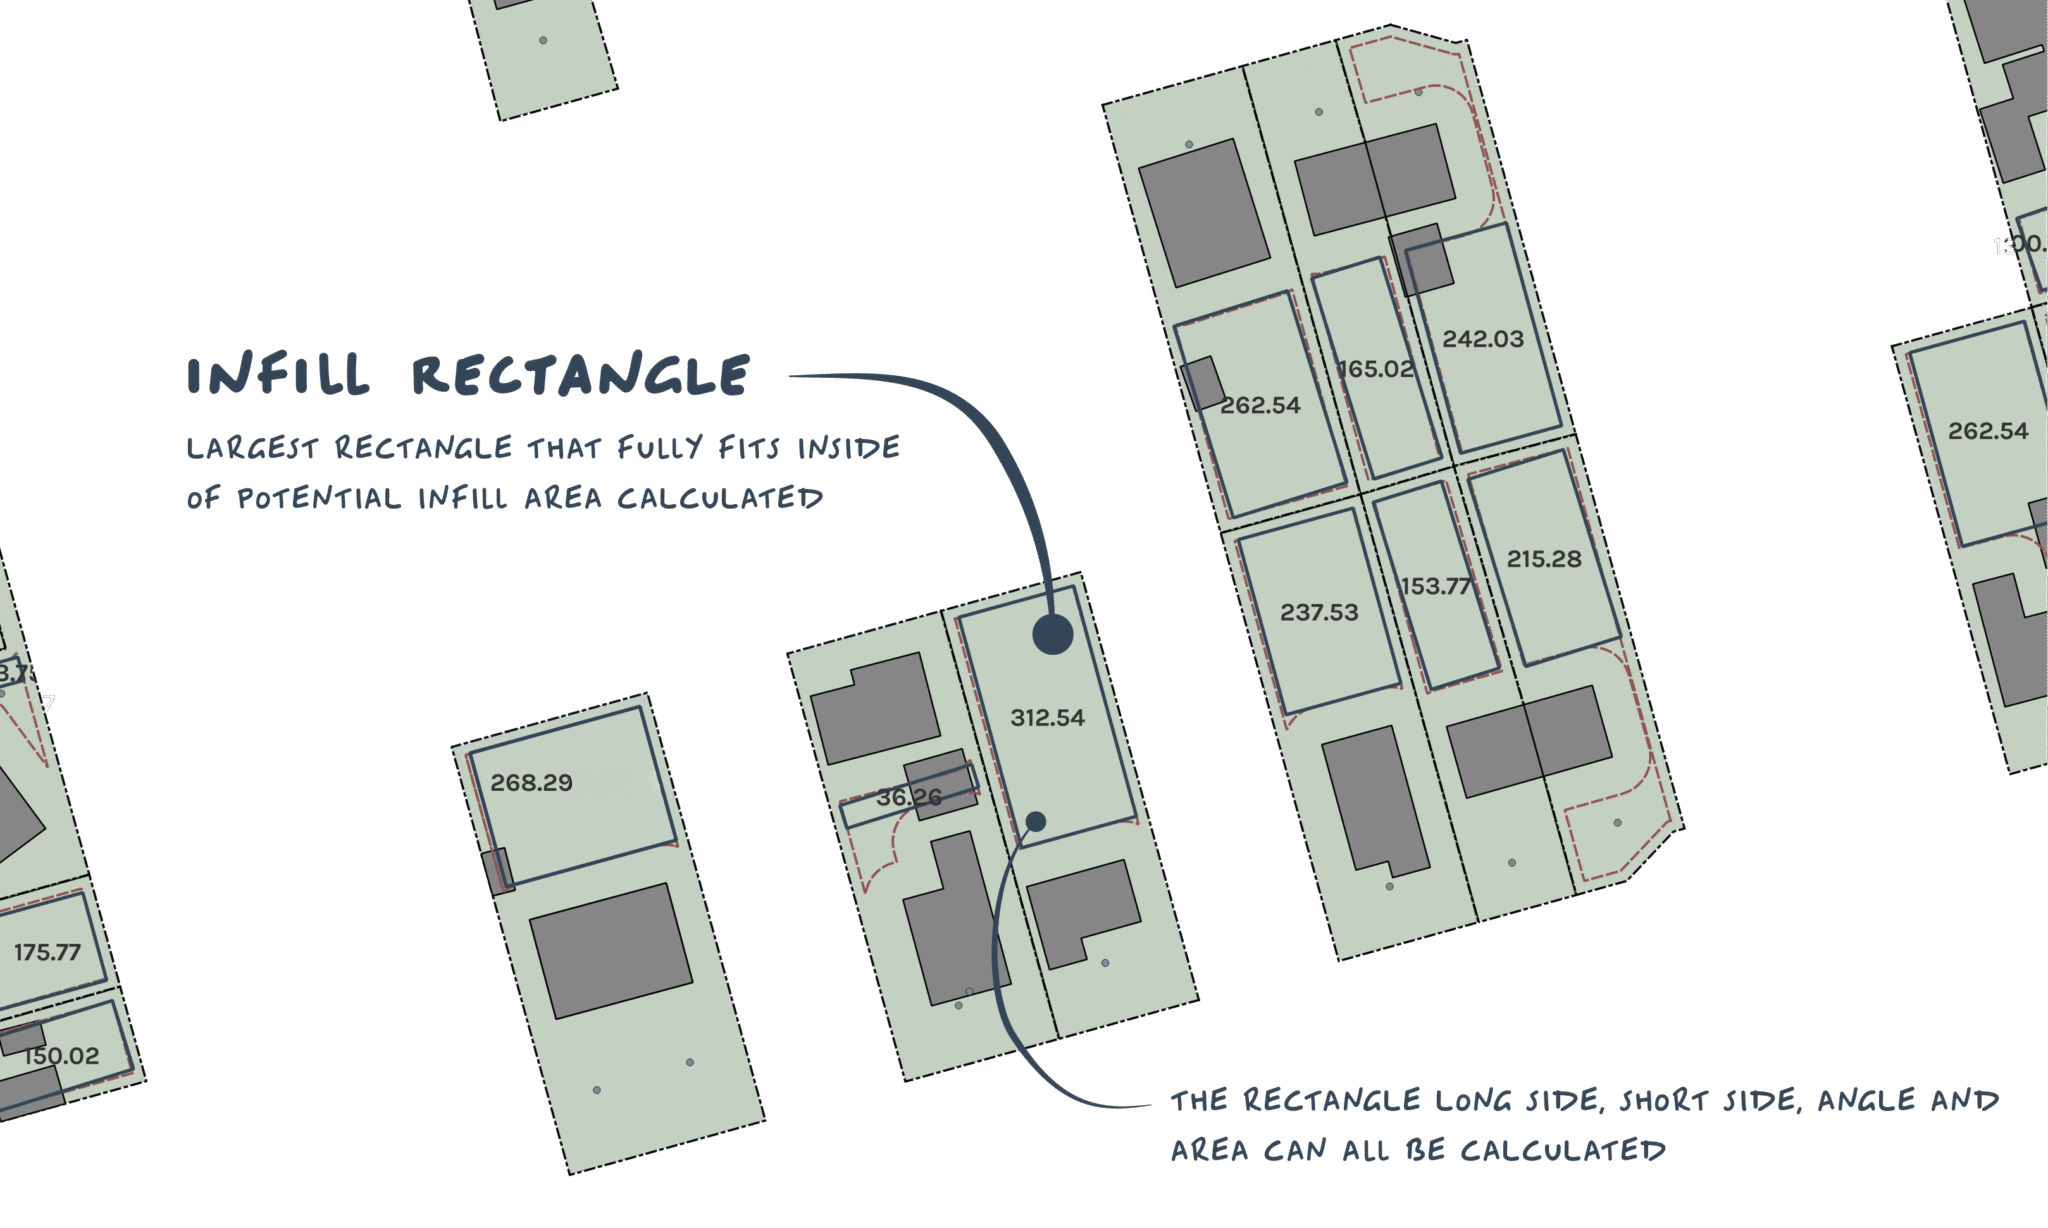
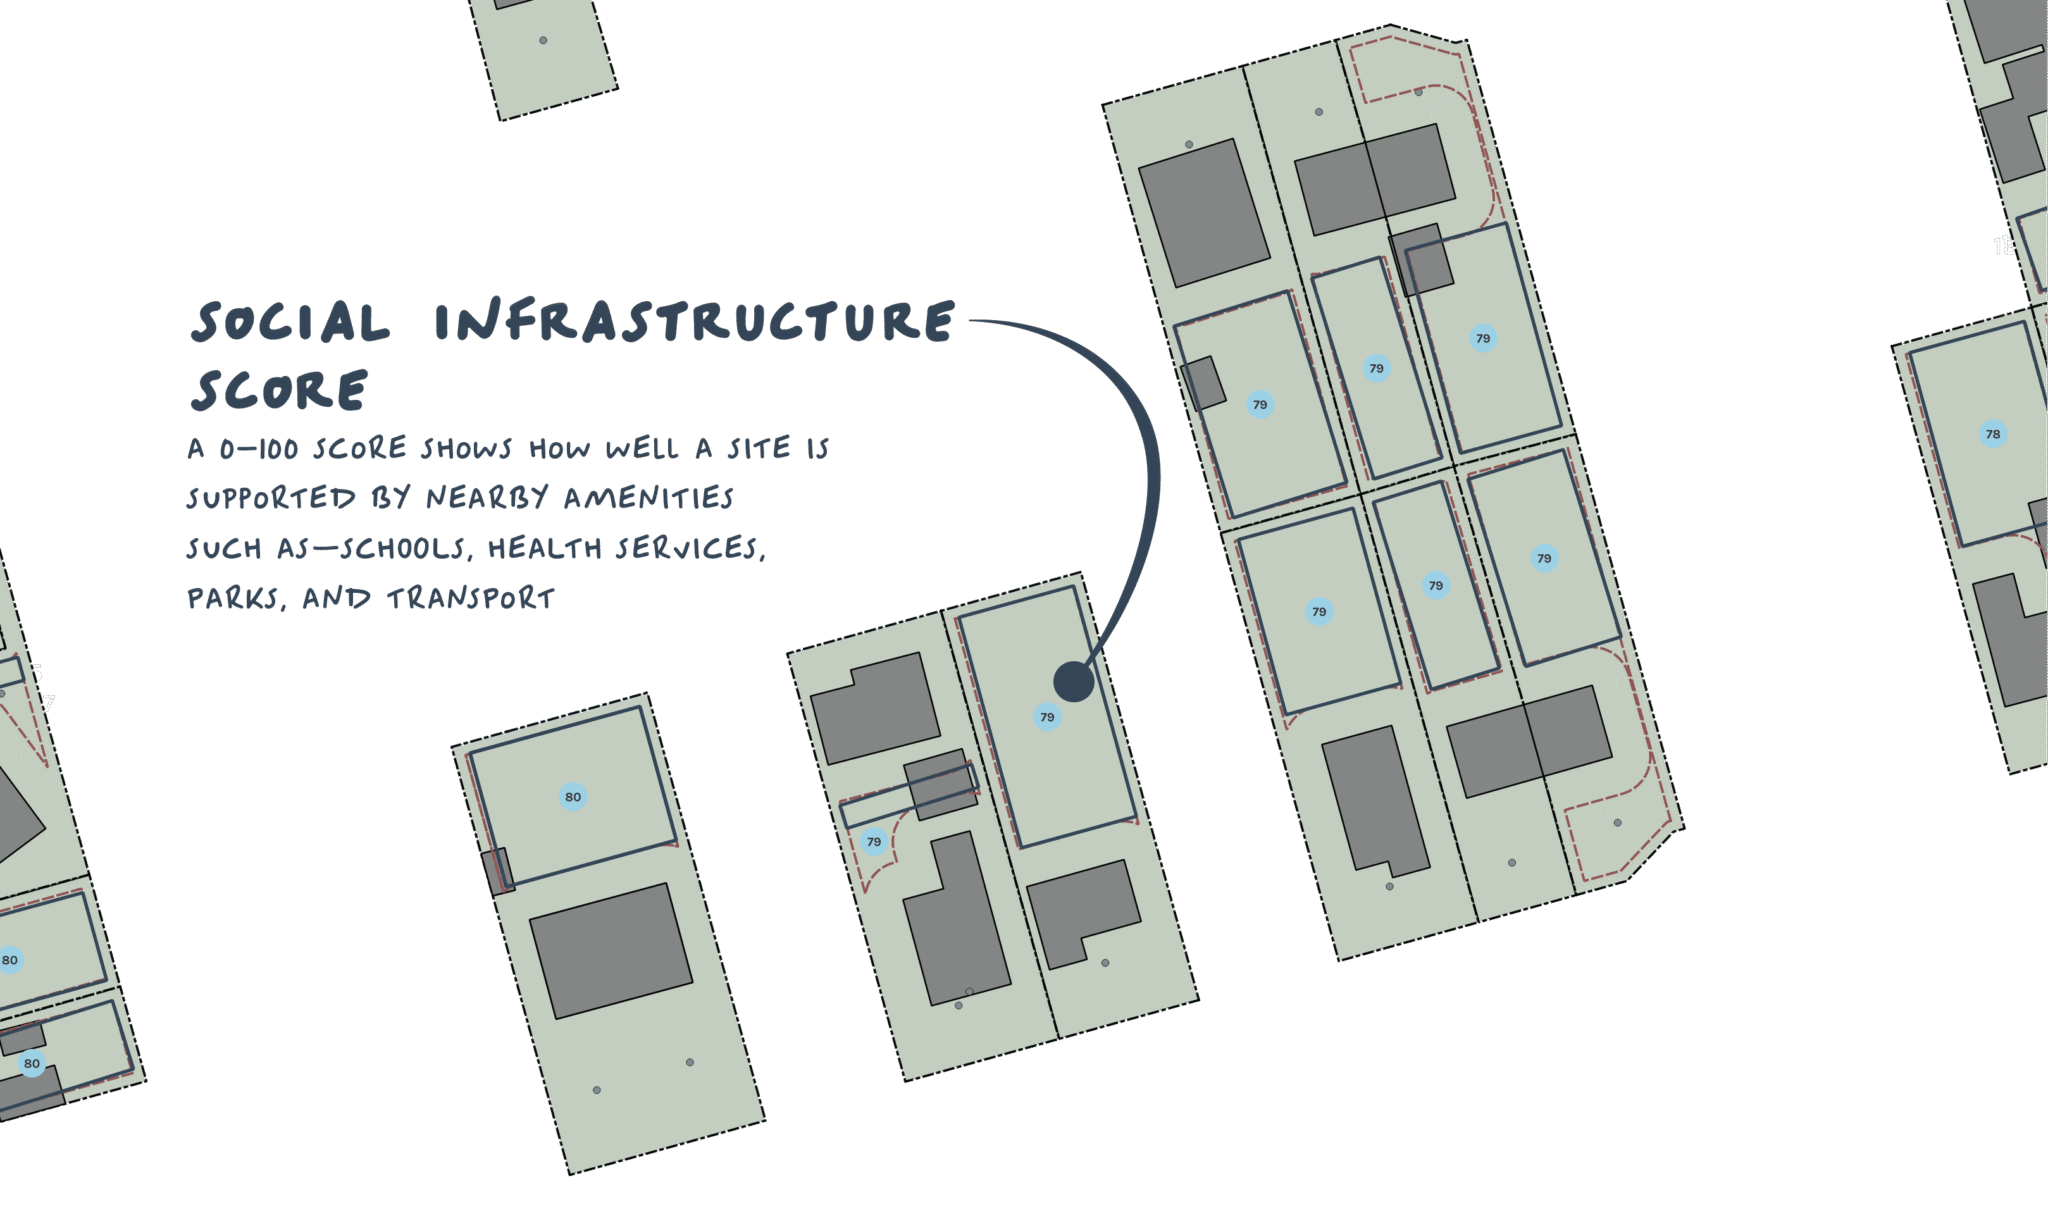
The interactive map
An online map was developed to make the data accessible. This is shown below. Every public housing site in the country is shown. Sites that can support infill are marked with coloured dots, each labelled with a social infrastructure score. Zooming in reveals the potential infill rectangle and the type of housing it could hold — for example, a larger two-plus bedroom unit or a smaller one-bedroom dwelling. Sites unsuitable for Bluefield infill are also included, with the reason explained: too steep, too small, or already too intensively developed.
Capacity vs demand
The tables in the drop-down tabs below illustrate which areas could Bluefield developments be used most effectively to address current public housing. They show both the total capacity Bluefield housing could provide as well as estimate the total demand for public housing in each of the sixty-seven Territorial authority in Aotearoa New Zealand
As each site has been tested individually, the potential capacity of Bluefield housing by be measured by combining all the infill opportunities within a territorial authority. This capacity can be expressed in two ways: the maximum infill possible under current planning rules, and the additional potential that might be unlocked through planning reform or site-specific resource consents.
Demand is more complex to measure, as there is no single dataset that identifies to total number of public houses required to ensure that every potential public housing tenant would have a house.
For the tables below demand was calculated using the Housing Deprivation (homelessness) Index from the 2023 Census. This index categories people experiencing homelessness into four categories: people without shelter, people in temporary accommodation, people sharing overcrowded private dwellings, and people in uninhabitable housing without basic amenities. To estimate total demand those categories, excluding people in uninhabitable housing where combined. Those in uninhabitable housing where excluded as they have physical homes, it’s just that those homes would require to be upgraded to meet a basic minimum living standard.
Bluefield housing is not a suitable housing option for every person. Many people currently in need of housing face complex challenges and need more specialised housing and additional support. As such, the intent Bluefield housing would be to work with existing suitable tenants. By relocating these tenants’ further capacity could be crated through the sites that they vacate.
Auckland Local Boards
Urban centres (Excluding Auckland)
Regional centres
The nitty gritty
The full dataset is available to download, including an Excel file of all 42,800 sites and the georeferenced shapefiles used in the analysis. Each site has been individually tested against the three filters, and because the filters are independent, the data can be recombined in multiple ways.
The high-level table provided here shows, for each Territorial Authority, the estimated demand, the maximum capacity of Bluefield sites, the average social infrastructure score, and the site type in terms of how connected it is to other public housing.
This dataset could be applied in a range of other ways. Councils or providers could produce suburb-by-suburb breakdowns of demand and capacity. Tenant profiles could be developed to weight infrastructure differently — for example, proximity to healthcare for older residents, or proximity to schools and sports fields for families. Clusters of under-utilised sites could also be identified as opportunities for larger-scale redevelopment, even if they are not suitable for Bluefield-type infill housing.
| TA Name | Housing Deprivation (excl. Uninhabitable) | Housing Register (Mar 2023) | Physical Capacity (units, excl. planning) | Total Allowable Units | Allowable Units as % of Deprivation | Avg. Social Infrastructure Score | % Island Sites (0 connections) | % Single-Sided Sites (1 connection) | % Dual-Sided Sites (2 connections) | % Cluster Sites (2+ connections) |
|---|---|---|---|---|---|---|---|---|---|---|
| Far North District | 1381 | 480 | 266 | 184 | 13.32% | 64.48 | 43.32% | 36.21% | 13.79% | 6.68% |
| Whangarei District | 1022 | 558 | 568 | 445 | 43.55% | 77.11 | 25.58% | 33.09% | 23.82% | 17.52% |
| Kaipara District | 226 | 78 | 51 | 44 | 19.44% | 60.73 | 31.65% | 41.77% | 20.25% | 6.33% |
| Thames-Coromandel District | 352 | 84 | 59 | 52 | 14.78% | 62.57 | 25.14% | 33.88% | 20.77% | 20.22% |
| Hauraki District | 181 | 60 | 62 | 52 | 28.66% | 68.79 | 52.33% | 33.72% | 10.47% | 3.49% |
| Waikato District | 552 | 243 | 208 | 169 | 30.62% | 80.35 | 40.12% | 40.72% | 12.87% | 6.29% |
| Matamata-Piako District | 203 | 90 | 122 | 99 | 48.79% | 75.24 | 43.02% | 34.30% | 17.44% | 5.23% |
| Hamilton City | 1671 | 1677 | 926 | 835 | 49.98% | 83.53 | 24.92% | 28.19% | 26.21% | 20.68% |
| Waipa District | 200 | 96 | 144 | 116 | 57.97% | 76.11 | 45.65% | 30.00% | 17.39% | 6.96% |
| Otorohanga District | 69 | 21 | 18 | 9 | 13.10% | 71.54 | 50.00% | 33.33% | 8.33% | 8.33% |
| South Waikato District | 278 | 132 | 27 | 20 | 7.18% | 74.36 | 89.74% | 10.26% | 0.00% | 0.00% |
| Waitomo District | 136 | 54 | 28 | 22 | 16.21% | 83.8 | 48.44% | 39.06% | 7.81% | 4.69% |
| Taupo District | 317 | 210 | 43 | 37 | 11.68% | 79.68 | 68.64% | 23.73% | 2.54% | 5.08% |
| Western Bay of Plenty District | 679 | 186 | 5 | 2 | 0.29% | 63.73 | 9.09% | 72.73% | 0.00% | 18.18% |
| Tauranga City | 1004 | 762 | 46 | 27 | 2.69% | 75.86 | 55.97% | 26.34% | 14.81% | 2.88% |
| Rotorua District | 876 | 897 | 413 | 273 | 31.16% | 81.19 | 30.90% | 30.74% | 23.45% | 14.90% |
| Whakatane District | 547 | 321 | 182 | 155 | 28.33% | 72.35 | 26.48% | 30.33% | 23.65% | 19.54% |
| Kawerau District | 145 | 84 | 28 | 24 | 16.55% | 62.59 | 77.27% | 22.73% | 0.00% | 0.00% |
| Opotiki District | 235 | 114 | 93 | 59 | 25.08% | 71.58 | 36.96% | 38.04% | 20.65% | 4.35% |
| Gisborne District | 966 | 582 | 831 | 587 | 60.74% | 60.74 | 21.39% | 30.35% | 26.05% | 22.21% |
| Wairoa District | 132 | 66 | 56 | 41 | 31.03% | 66.49 | 40.00% | 46.15% | 13.85% | 0.00% |
| Hastings District | 824 | 696 | 650 | 452 | 54.83% | 72.97 | 23.62% | 38.24% | 22.99% | 15.15% |
| Napier City | 692 | 690 | 560 | 358 | 51.72% | 86.81 | 29.51% | 32.87% | 22.78% | 14.85% |
| Central Hawke's Bay District | 103 | 69 | 35 | 30 | 29.10% | 54.59 | 54.35% | 32.61% | 10.87% | 2.17% |
| New Plymouth District | 514 | 390 | 367 | 277 | 53.87% | 77.15 | 34.14% | 38.82% | 16.20% | 10.84% |
| Stratford District | 54 | 42 | 33 | 21 | 38.68% | 74.25 | 55.00% | 17.50% | 15.00% | 12.50% |
| South Taranaki District | 140 | 129 | 71 | 57 | 40.83% | 75.48 | 60.00% | 26.32% | 9.47% | 4.21% |
| Ruapehu District | 137 | 72 | 45 | 31 | 22.55% | 52.17 | 62.26% | 22.64% | 15.09% | 0.00% |
| Whanganui District | 371 | 321 | 314 | 224 | 60.39% | 72.28 | 35.53% | 37.72% | 18.20% | 8.55% |
| Rangitikei District | 100 | 63 | 36 | 22 | 22.02% | 68.59 | 60.98% | 31.71% | 4.88% | 2.44% |
| Manawatu District | 134 | 120 | 124 | 87 | 64.83% | 55.02 | 30.67% | 30.00% | 26.00% | 13.33% |
| Palmerston North City | 481 | 642 | 605 | 482 | 100.26% | 73.35 | 24.76% | 34.81% | 23.79% | 16.64% |
| Tararua District | 163 | 42 | 7 | 4 | 2.45% | 62 | 16.67% | 33.33% | 50.00% | 0.00% |
| Horowhenua District | 249 | 180 | 131 | 101 | 40.54% | 76.18 | 36.94% | 35.14% | 19.37% | 8.56% |
| Kapiti Coast District | 275 | 168 | 61 | 39 | 14.21% | 72.79 | 52.83% | 32.08% | 9.43% | 5.66% |
| Porirua City | 559 | 327 | 927 | 790 | 141.38% | 81.71 | 19.43% | 35.91% | 26.47% | 18.18% |
| Upper Hutt City | 166 | 201 | 138 | 114 | 68.63% | 76.94 | 31.63% | 35.54% | 21.08% | 11.75% |
| Lower Hutt City | 732 | 540 | 1053 | 974 | 132.97% | 80.08 | 24.01% | 35.08% | 23.67% | 17.24% |
| Wellington City | 1360 | 765 | 178 | 135 | 9.93% | 81 | 33.96% | 31.72% | 19.81% | 14.50% |
| Masterton District | 150 | 123 | 32 | 20 | 13.36% | 76.42 | 14.55% | 9.09% | 25.45% | 50.91% |
| Carterton District | 39 | 18 | 0 | 0 | 0.00% | 0 | ||||
| South Wairarapa District | 42 | 21 | 2 | 1 | 2.36% | 77.5 | 100.00% | 0.00% | 0.00% | 0.00% |
| Tasman District | 627 | 141 | 76 | 52 | 8.30% | 82.18 | 38.18% | 30.91% | 16.97% | 13.94% |
| Nelson City | 586 | 261 | 133 | 96 | 16.37% | 76.18 | 32.48% | 23.36% | 23.13% | 21.03% |
| Marlborough District | 442 | 204 | 158 | 124 | 28.03% | 75.67 | 27.10% | 37.89% | 20.38% | 14.63% |
| Kaikoura District | 60 | 12 | 18 | 11 | 18.21% | 69.06 | 38.89% | 44.44% | 16.67% | 0.00% |
| Buller District | 175 | 75 | 72 | 48 | 27.35% | 74.72 | 50.00% | 25.00% | 18.75% | 6.25% |
| Grey District | 120 | 78 | 83 | 64 | 53.55% | 47.55 | 38.94% | 34.51% | 17.70% | 8.85% |
| Westland District | 142 | 27 | 22 | 14 | 9.89% | 68.58 | 76.92% | 11.54% | 7.69% | 3.85% |
| Hurunui District | 90 | 21 | 33 | 21 | 23.21% | 55 | 60.87% | 26.09% | 13.04% | 0.00% |
| Waimakariri District | 360 | 102 | 76 | 70 | 19.46% | 78.86 | 39.19% | 30.41% | 20.95% | 9.46% |
| Christchurch City | 2360 | 1887 | 1972 | 1712 | 72.54% | 81.86 | 20.79% | 33.69% | 25.20% | 20.32% |
| Selwyn District | 178 | 69 | 31 | 29 | 16.28% | 56.86 | 100.00% | 0.00% | 0.00% | 0.00% |
| Ashburton District | 149 | 63 | 154 | 119 | 80.02% | 59.29 | 28.19% | 43.09% | 20.21% | 8.51% |
| Timaru District | 210 | 105 | 167 | 133 | 63.29% | 64.65 | 42.43% | 33.55% | 17.11% | 6.91% |
| Mackenzie District | 118 | 0 | 0 | 0 | 0.00% | 0 | ||||
| Waimate District | 51 | 12 | 18 | 10 | 19.45% | 55.17 | 66.67% | 33.33% | 0.00% | 0.00% |
| Chatham Islands Territory | 12 | 0 | 0 | 0 | 0.00% | 0 | ||||
| Waitaki District | 189 | 36 | 59 | 49 | 25.90% | 56.82 | 57.45% | 26.60% | 9.57% | 6.38% |
| Central Otago District | 192 | 0 | 11 | 8 | 4.17% | 71.11 | 84.21% | 0.00% | 15.79% | 0.00% |
| Queenstown-Lakes District | 576 | 15 | 2 | 1 | 0.17% | 61 | 44.44% | 22.22% | 33.33% | 0.00% |
| Dunedin City | 1008 | 408 | 526 | 427 | 42.36% | 64.09 | 34.17% | 38.30% | 18.48% | 9.06% |
| Clutha District | 111 | 33 | 13 | 11 | 9.93% | 60.72 | 55.17% | 24.14% | 17.24% | 3.45% |
| Southland District | 196 | 30 | 1 | 1 | 0.51% | 67.5 | 100.00% | 0.00% | 0.00% | 0.00% |
| Gore District | 49 | 36 | 15 | 12 | 24.59% | 57 | 76.19% | 19.05% | 4.76% | 0.00% |
| Invercargill City | 358 | 201 | 156 | 135 | 37.70% | 61.75 | 43.75% | 32.50% | 15.94% | 7.81% |
| Rodney Local Board Area | 308 | 93 | 8 | 6 | 1.95% | 87.4 | 28.57% | 17.14% | 14.29% | 40.00% |
| Hibiscus and Bays Local Board Area | 298 | 138 | 13 | 13 | 4.37% | 76.32 | 44.93% | 24.64% | 23.19% | 7.25% |
| Upper Harbour Local Board Area | 256 | 102 | 0 | 0 | 0.00% | 81.44 | 55.56% | 37.04% | 7.41% | 0.00% |
| Kaipatiki Local Board Area | 453 | 216 | 105 | 100 | 22.08% | 80.27 | 35.50% | 25.84% | 19.54% | 19.12% |
| Devonport-Takapuna Local Board Area | 131 | 87 | 65 | 60 | 45.97% | 83.21 | 25.77% | 42.33% | 20.86% | 11.04% |
| Henderson-Massey Local Board Area | 1324 | 609 | 249 | 190 | 14.35% | 84.54 | 35.53% | 31.72% | 20.78% | 11.98% |
| Waitakere Ranges Local Board Area | 271 | 141 | 29 | 21 | 7.76% | 80.01 | 47.81% | 29.88% | 13.94% | 8.37% |
| Aotea/Great Barrier Local Board Area | 75 | 0 | 0 | 0 | 0.00% | 0 | ||||
| Waiheke Local Board Area | 111 | 0 | 1 | 1 | 0.90% | 78 | 100.00% | 0.00% | 0.00% | 0.00% |
| Waitemata Local Board Area | 1239 | 357 | 99 | 62 | 5.01% | 94.04 | 28.87% | 43.66% | 12.32% | 15.14% |
| Whau Local Board Area | 796 | 435 | 230 | 152 | 19.08% | 89.79 | 30.34% | 31.66% | 23.56% | 14.43% |
| Albert-Eden Local Board Area | 961 | 405 | 417 | 385 | 40.04% | 90.12 | 27.85% | 39.34% | 20.60% | 12.22% |
| Puketapapa Local Board Area | 533 | 234 | 675 | 612 | 114.81% | 88.06 | 12.00% | 34.47% | 27.71% | 25.82% |
| Orakei Local Board Area | 245 | 132 | 144 | 116 | 47.43% | 88.44 | 30.06% | 40.17% | 16.57% | 13.20% |
| Maungakiekie-Tamaki Local Board Area | 1085 | 417 | 416 | 369 | 34.01% | 91.96 | 17.72% | 33.02% | 27.55% | 21.71% |
| Howick Local Board Area | 901 | 291 | 53 | 39 | 4.33% | 83.77 | 30.81% | 25.12% | 23.70% | 20.38% |
| Mangere-Otahuhu Local Board Area | 2329 | 795 | 892 | 785 | 33.70% | 85.88 | 16.93% | 28.49% | 28.25% | 26.33% |
| Otara-Papatoetoe Local Board Area | 2090 | 714 | 1234 | 857 | 41.00% | 87.21 | 17.34% | 29.32% | 30.21% | 23.13% |
| Manurewa Local Board Area | 1862 | 729 | 308 | 247 | 13.26% | 89.27 | 33.46% | 27.93% | 21.58% | 17.03% |
| Papakura Local Board Area | 1084 | 492 | 261 | 243 | 22.42% | 85.03 | 22.79% | 34.71% | 25.07% | 17.44% |
| Franklin Local Board Area | 454 | 165 | 108 | 92 | 20.27% | 82.35 | 21.80% | 33.79% | 24.25% | 20.16% |
| Area Outside Territorial Authority | 8 | 1275 | 0 | 0 | 0.00% | 0 | ||||
| Grand Total | 43634 | 24057 | 18648 | 14968 | 30% | 69.46 | 42% | 30% | 17% | 11% |
